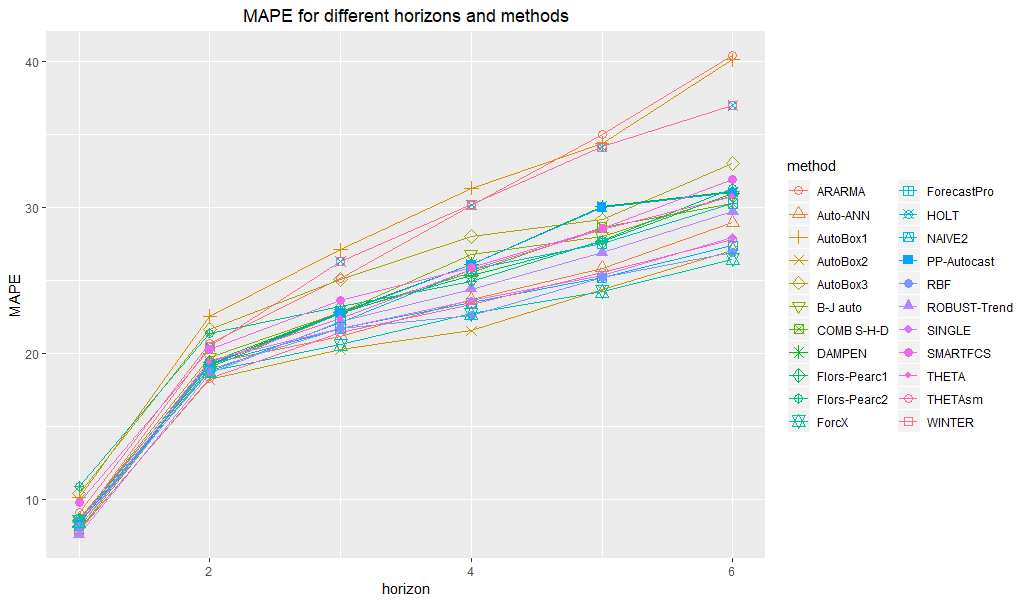
Point forecasts evaluation
Mean absolute percentage error for different forecasting methods and different horizons is generated using the function calculateMAPEs of the forvision package for the given data from dataset.
library(forvision)
calculateMAPEs(af)
## $`MAPE`
horizon = 1 horizon = 2 horizon = 3 horizon = 4 horizon = 5 horizon = 6 average MAPE
## NAIVE2 8.360053 19.23712 21.70531 23.45871 25.17578 27.35164 20.88143
## SINGLE 8.426719 19.53460 21.70985 23.59725 25.35748 27.93413 21.09334
## HOLT 8.504891 20.45405 26.28356 30.15786 34.12761 36.96884 26.08280
## DAMPEN 8.161127 19.23165 22.76975 26.09369 30.03716 31.06058 22.89233
## WINTER 8.504891 20.45405 26.28356 30.15786 34.12761 36.96884 26.08280
## COMB S-H-D 7.964892 19.02728 22.76000 25.56244 28.63649 30.24861 22.36662
## B-J auto 8.638050 19.71086 22.78263 26.77603 27.99026 30.82170 22.78659
## AutoBox1 10.119198 22.51186 27.07629 31.31042 34.37756 40.08493 27.58004
## AutoBox2 7.951192 18.21996 20.24227 21.53416 24.35192 27.06316 19.89378
## AutoBox3 10.421066 21.64715 25.06411 28.00895 29.13955 32.99808 24.54648
## ROBUST-Trend 7.606495 18.64720 22.18879 24.39184 26.91103 29.70701 21.57539
## ARARMA 9.091266 20.68177 25.10429 30.14883 34.99774 40.38033 26.73404
## Auto-ANN 8.697692 19.30203 21.17230 23.69814 25.82926 28.95334 21.27546
## Flors-Pearc1 8.561016 19.38149 22.80052 25.34184 27.62398 30.95579 22.44410
## Flors-Pearc2 10.903332 21.38609 23.17941 24.91399 27.72512 31.29920 23.23452
## PP-Autocast 8.141452 19.19054 22.75382 26.06017 29.99119 30.98797 22.85419
## ForecastPro 8.426093 18.77205 22.10483 25.76225 27.52447 30.24350 22.13887
## SMARTFCS 9.796722 20.29223 23.64564 25.85210 28.55908 31.87433 23.33668
## THETAsm 7.907310 18.26210 21.41826 23.33240 25.50224 27.78079 20.70052
## THETA 8.172273 19.38538 22.36993 25.71969 28.45272 30.72379 22.47063
## RBF 8.146542 18.86758 21.67786 22.58918 25.20706 26.92872 20.56949
## ForcX 8.495870 18.75417 20.60045 22.70112 24.23433 26.42823 20.20236
## $rank
horizon = 1 horizon = 2 horizon = 3 horizon = 4 horizon = 5 horizon = 6 average rank
## NAIVE2 9.0 10.0 6.0 5.0 3.0 4.0 6.166667
## SINGLE 11.0 14.0 7.0 6.0 5.0 6.0 8.166667
## HOLT 13.5 17.5 20.5 20.5 19.5 19.5 18.500000
## DAMPEN 7.0 9.0 13.0 16.0 18.0 15.0 13.000000
## WINTER 13.5 17.5 20.5 20.5 19.5 19.5 18.500000
## COMB S-H-D 4.0 7.0 12.0 11.0 15.0 10.0 9.833333
## B-J auto 16.0 15.0 14.0 17.0 12.0 12.0 14.333333
## AutoBox1 20.0 22.0 22.0 22.0 21.0 21.0 21.333333
## AutoBox2 3.0 1.0 1.0 1.0 2.0 3.0 1.833333
## AutoBox3 21.0 21.0 18.0 18.0 16.0 18.0 18.666667
## ROBUST-Trend 1.0 3.0 9.0 8.0 8.0 8.0 6.166667
## ARARMA 18.0 19.0 19.0 19.0 22.0 22.0 19.833333
## Auto-ANN 17.0 11.0 3.0 7.0 7.0 7.0 8.666667
## Flors-Pearc1 15.0 12.0 15.0 10.0 10.0 13.0 12.500000
## Flors-Pearc2 22.0 20.0 16.0 9.0 11.0 16.0 15.666667
## PP-Autocast 5.0 8.0 11.0 15.0 17.0 14.0 11.666667
## ForecastPro 10.0 5.0 8.0 13.0 9.0 9.0 9.000000
## SMARTFCS 19.0 16.0 17.0 14.0 14.0 17.0 16.166667
## THETAsm 2.0 2.0 4.0 4.0 6.0 5.0 3.833333
## THETA 8.0 13.0 10.0 12.0 13.0 11.0 11.166667
## RBF 6.0 6.0 5.0 2.0 4.0 2.0 4.166667
## ForcX 12.0 4.0 2.0 3.0 1.0 1.0 3.833333

To cite this website, please use the following reference:
Sai, C., Davydenko, A., & Shcherbakov, M. (date). The Forvision Project. Retrieved from https://forvis.github.io/
© 2020 Sai, C., Davydenko, A., & Shcherbakov, M. All Rights Reserved. Short sections of text, not exceed two paragraphs, may be quoted without explicit permission, provided that full acknowledgement is given.