Fixed origin graph
The function plotFixedOrigin of the forvision package plots the fixed origin graph for the given data from dataset.
Here’s a fixed origin graph created by the function plotFixedOrigin for time series of id = “M1”:
# Load time series and forecast data
library(forvision)
ts <- m3_monthly_ts
fc <- m3_monthly_fc

# prepare appropriate time-based object timestamp columns for the data_ts and data_fs
library(zoo)
ts$timestamp_dbo <- as.yearmon(ts$timestamp, format = '%Y-%m')
fc$timestamp_dbo <- as.yearmon(fc$timestamp, '%Y-%m')

# Plot
plotFixedOrigin(ts, "M1")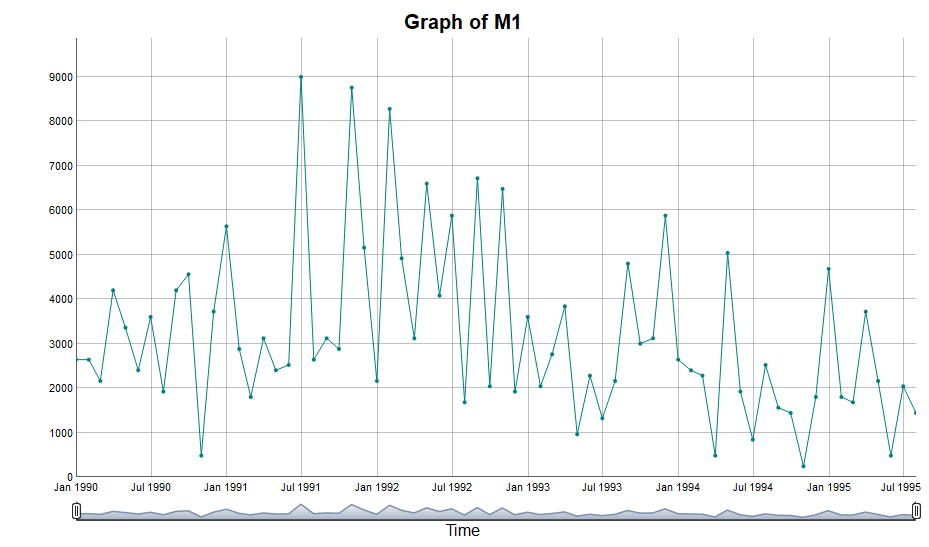
The fixed origin graph with the forecasts of the single forecast method by using the option setting method:
plotFixedOrigin(ts, fc, "M1", "1994-02", "AutoBox1")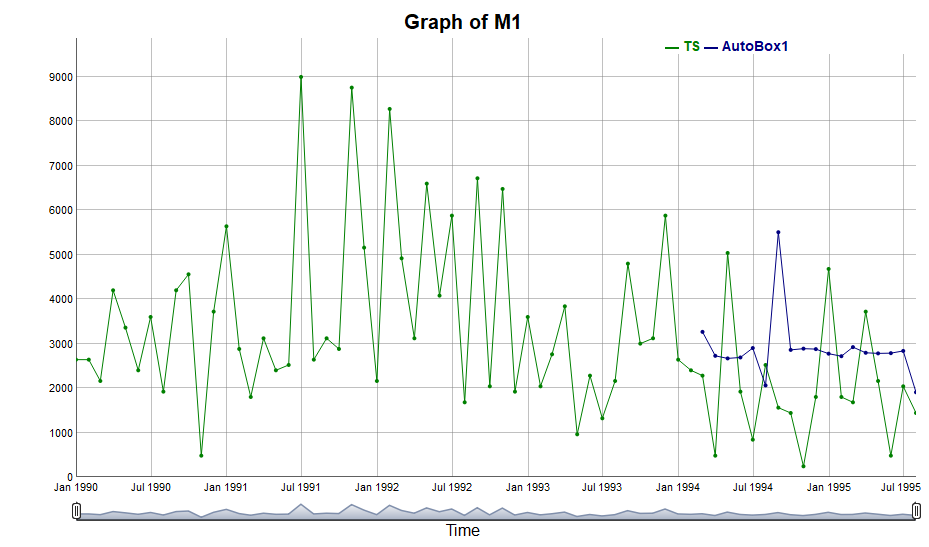
The fixed origin graph with the forecasts of the multiple forecast methods by using the option setting method:
plotFixedOrigin(ts, fc, "M1", "1994-02", c("AutoBox1", "AutoBox3")) 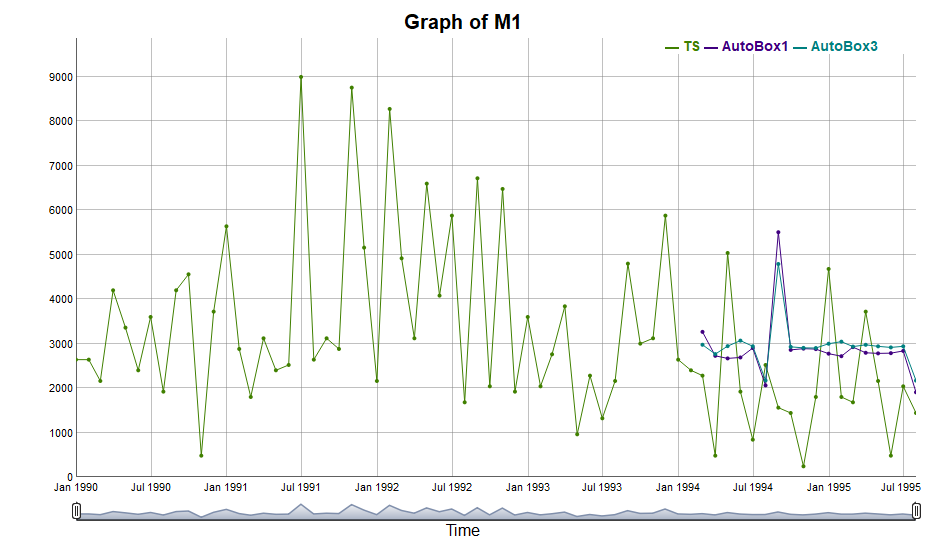
To cite this website, please use the following reference:
Sai, C., Davydenko, A., & Shcherbakov, M. (date). The Forvision Project. Retrieved from https://forvis.github.io/
© 2020 Sai, C., Davydenko, A., & Shcherbakov, M. All Rights Reserved. Short sections of text, not exceed two paragraphs, may be quoted without explicit permission, provided that full acknowledgement is given.