Prediction-Realization Diagram
The function plotPRD of the forvision package plots the Prediction-Realization Diagram for the given data from dataset containing columns value, forecast, and method (AFTS).
Here’s a prediction-realization diagram created by the function plotPRD:
# Load time series and forecast data
library(forvision)
ts <- m3_yearly_ts
fc <- m3_yearly_fc
# Create AFTS shema
af <- createAFTS(ts, fc)
plotPRD(af)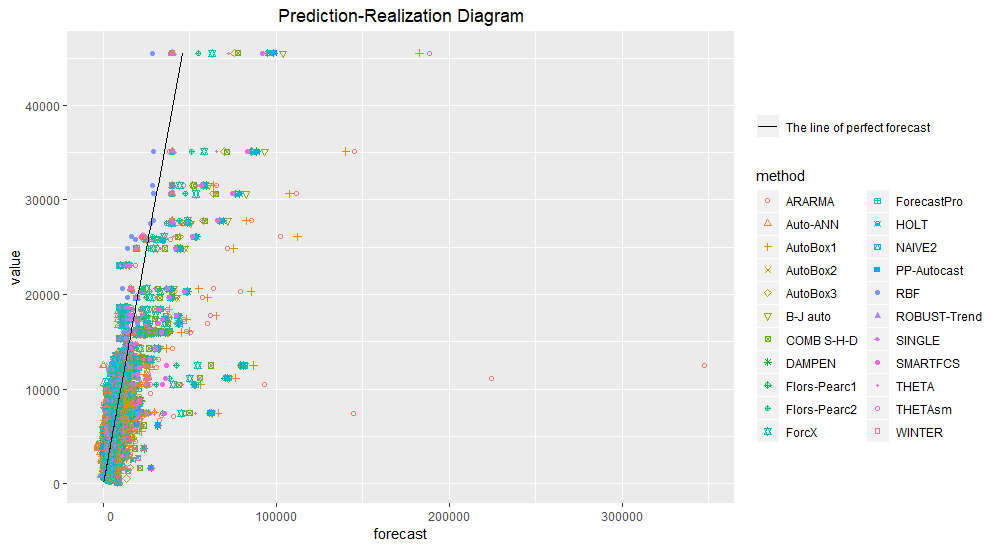
The resulting prediction-relization digram plotted in logarithmic scales by using the option setting useLog = TRUE:
plotPRD(af, useLogs = TRUE)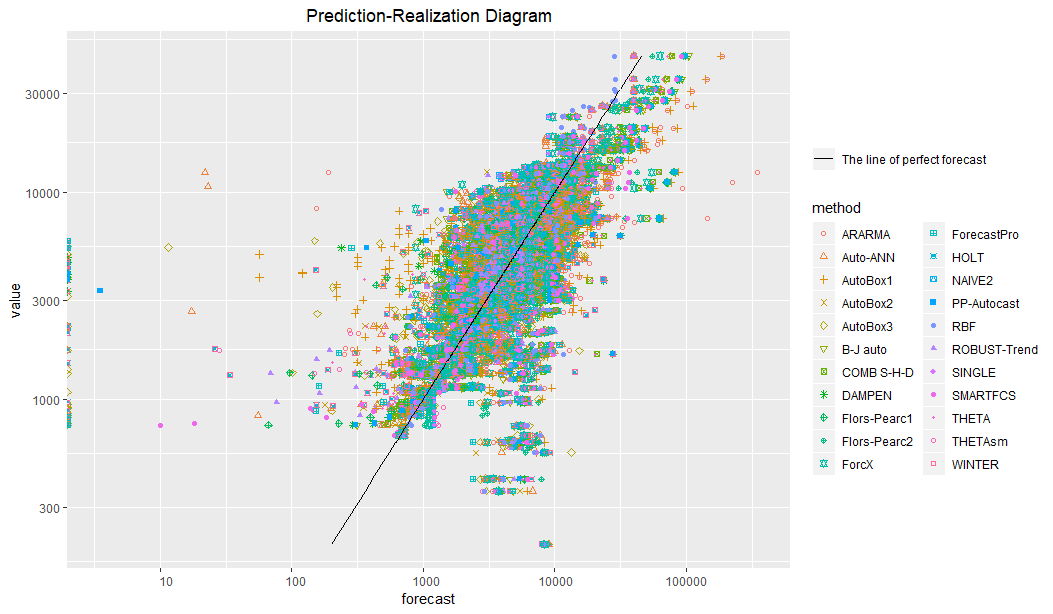
The prediction-realization diagram for the selected methods:
# For the methods "ARARMA", "Auto-ANN", and "DAMPEN"
data1 <- subset(af, method == c("ARARMA", "Auto-ANN", "DAMPEN"))
plotPRD(data1)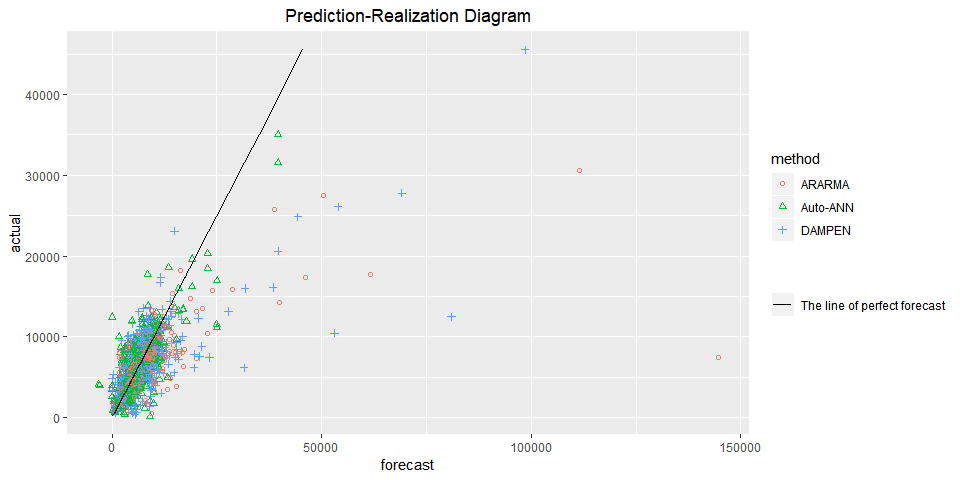
The prediction-realization diagram for the selected horizon:
# For the horizons 1, 2
data2 <- subset(af, horizon == 1)
plotPRD(data2)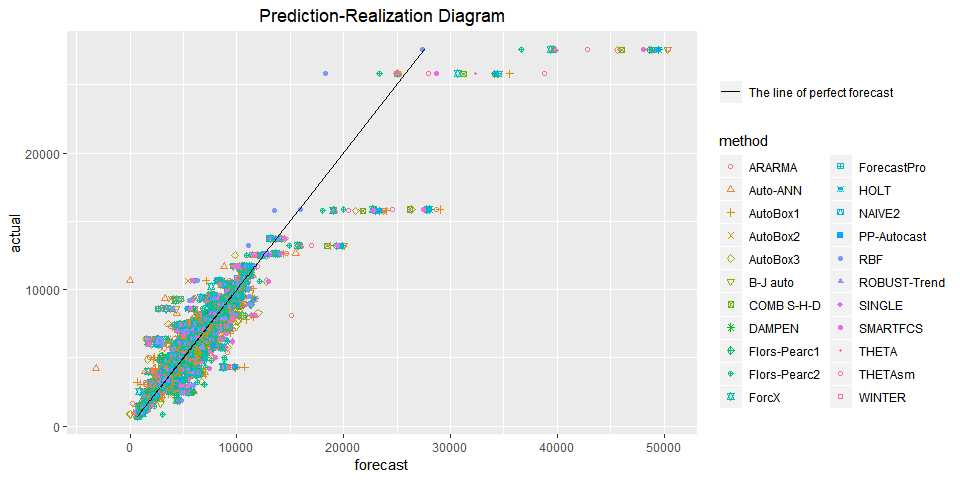
To cite this website, please use the following reference:
Sai, C., Davydenko, A., & Shcherbakov, M. (date). The Forvision Project. Retrieved from https://forvis.github.io/
© 2020 Sai, C., Davydenko, A., & Shcherbakov, M. All Rights Reserved. Short sections of text, not exceed two paragraphs, may be quoted without explicit permission, provided that full acknowledgement is given.