The project’s aim is to develop effective means for forecast evaluation and visualization. Based on our experience of implementing data science solutions for forecasting, we outline a typical forecast evaluation setup. Especially, we focus on handling rolling-origin forecasts made across many series over multiple horizons when many alternative methods are used.
We developed a general framework containing of the following components:
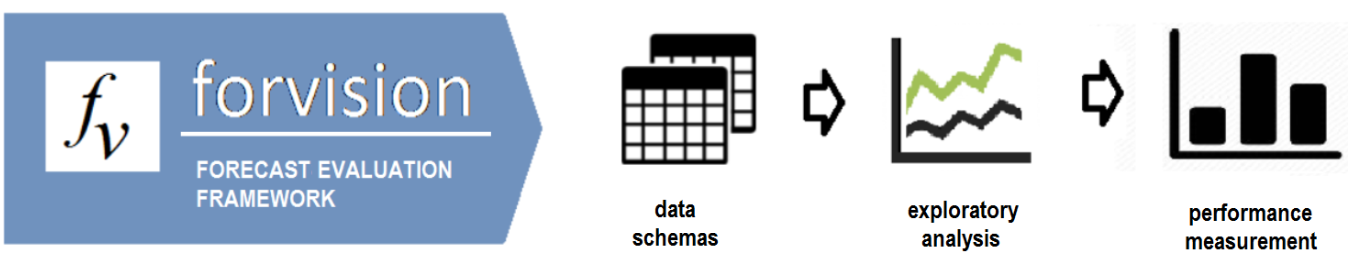
Forecast data formats - simple yet flexible enough data structures designed to store data needed for rolling-origin forecast evaluation.
Exploratory analysis tools needed to make sure that data is of acceptable quality.
Performance measurement tools - techniques and graphs for accuracy and comparison.
Generally, the workflow we propose involves the following steps: 1) data preparation, 2) exploratory analysis, 3) performance measurement using appropriate metrics. The workflow section describes this process in more detail.
Some components were implemented within the forvision R-package.
Preliminary results were published here:
Sai, C., Davydenko, A., & Shcherbakov, M. (November 23-24, 2018). Data schemas for forecasting (with examples in R). Seventh International Conference on System Modelling & Advancement on Research Trends (pp. 145-149). Moradabad, India.
© 2020 Sai, C., Davydenko, A., & Shcherbakov, M. All Rights Reserved. Short sections of text, not exceed two paragraphs, may be quoted without explicit permission, provided that full acknowledgement is given.